Nitrogen residue following different crops is an important consideration in the N fertiliser requirement of the subsequent crop and one of the key determinants of N fertiliser recommendations in the UK. Soil N Supply (SNS) for a crop can be estimated in autumn or spring before any N fertiliser has been applied by measurement of soil mineral N (SMN) and crop N, plus an estimate for mineralisable-N. Work conducted at ADAS between 2008 and 2010 showed that previous crop is one of the most important factors explaining differences in harvested SNS (crop N uptake at harvest of unfertilised crop). The adjustments recommended in the Fertiliser Manual (RB209) allow for N residues, those from oilseed rape, beans, peas or potatoes being considered similar, and ranging from 25 to 100 kg/ha N depending on the soil texture and amount of over-winter rainfall, and thus the retention of the residue over winter.
The ultimate measure of SNS for a cereal crop is the total nitrogen uptake of an unfertilised crop at harvest. There has been a perception that achievable yields and available nitrogen of cereal crops following crops of beans may be greater than those following oilseed rape, perhaps due to structural and biological differences in the soil and differences in mineralisation of N through the season.
Comparisons between crops following oilseed rape and beans from 2011 to 2015 showed no significant differences in spring SNS, harvested SNS or wheat yield.
There is a widely held perception that soils following bean crops have a better structure than when following oilseed rape, and anecdotally many report better yields following beans than OSR. Reviews have reported various benefits to the following crop of pulse crops relative to other break crops (Angus et al., 2015; Luce et al., 2015; Preissel et al., 2015).
Methods:
In 2011 paired sites were used to give comparable fields on the same farm of a wheat crop following beans/peas with a wheat crop following OSR. In 2012, 2013, 2014 and 2015 paired sites were again used but with 5 sites after spring beans and 5 sites after winter beans. At each site a small area (10m x 10m) was marked and kept free from N fertiliser (0N) until harvest.
From each site soil mineral N (SMN) samples were taken to 90cm depth in spring (February), from 9 cores within the 10m x 10m area, bulked to 1 sample each of 30cm horizons. Visual estimates were made of crop size to estimate N in the crop. Soil samples were sent for analysis of ammonium-N and nitrate-N.
Before harvest nine 0.25m2 quadrats were taken from the unfertilised crop area and from the adjacent crop where commercial N rates had been applied, by cutting shoots at ground level. Fresh weights were measured, and subsamples taken weighed when fresh, dried and re-weighed. Ears were separated from stems and threshed, dry weight of grain was measured, and grain samples sent for N% analysis by Dumas method. Chaff was recombined with straw and sent for N% analysis. Grain yields (t/ha) and total N uptake (kg/ha) were calculated, with total N uptake from the 0N areas being a measure of ‘harvested SNS’.
Results
Paired T-tests (by spring SNS and harvested SNS), indicated OSR and pulses provided significantly (P <0.001) more N (at 22 and 25 kg N/ha, respectively) to the following winter wheat crop than is predicted by spring SNS measurements. However, as demonstrated by Figure 1, there was a large inter-year variability and, in some instances, harvested SNS could be much lower (by up to c.55 kg N/ha) compared to spring SNS measurements.
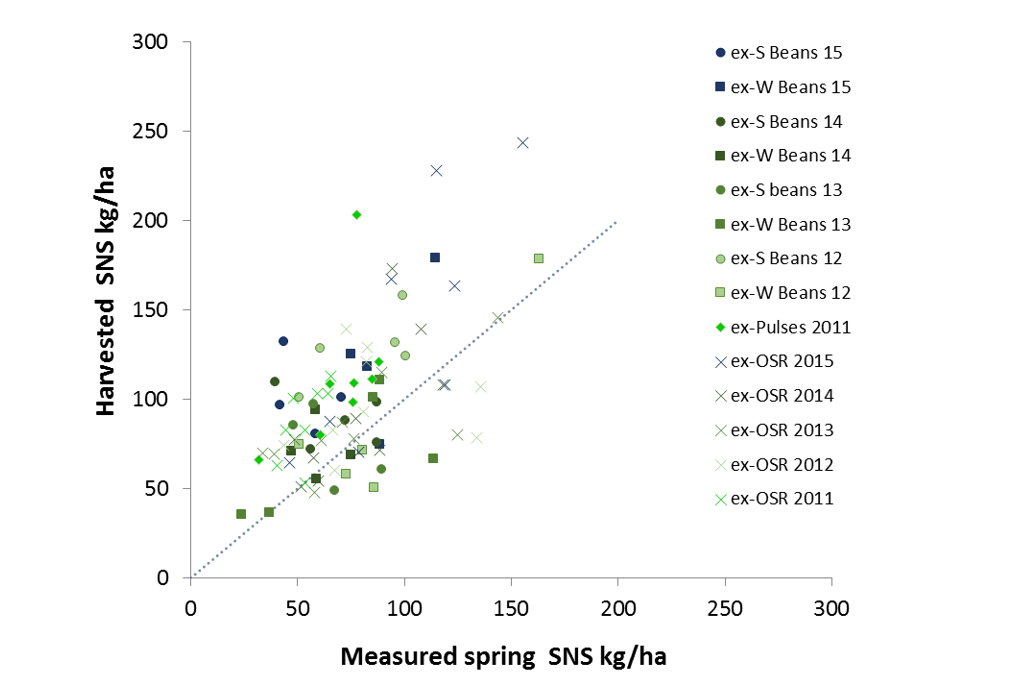
Figure 1. Soil N supply measured in spring (SMN plus crop N) and in the unfertilised crop at harvest (harvested SNS) for ex-pulse and ex-OSR cereal sites in 2011, 2012, 2013, 2014 and 2015. Dotted line represents 1:1 line.
Overall, paired T-tests, grouping data by year and all years combined (Table 1) indicated there were no differences (P >0.05) in spring SNS, harvested SNS and winter wheat yields between pulse and OSR paired sites. The only significant differences occurred in spring SNS in 2011 and 2015. In 2011, spring SNS following pulses (mean = 70 kg N/ha) was significantly (P =0.03) greater compared to OSR (mean = c.60 kg N/ha). While in 2015, spring SNS following OSR (mean = c.100 kg N/ha) was significantly (P =0.04) greater compared to following pulses (mean = c.70 kg N/ha). Nevertheless, in 2011 and 2015, there were no significant (P >0.05) differences following pulses or OSR in either harvested SNS or winter wheat yield.
|
Table 1: Summary of means, mean differences, and P-values of paired T-tests for, spring SNS, harvested SNS and winter wheat yields for paired pulse and OSR sites for all years combined and by year. |
|||||||
|
Measurement |
Year |
Units |
Mean following OSR |
Mean following Pulse |
Mean difference (OSR minus pulse) |
Standard deviation of mean difference |
Paired T-test P-value |
|
Spring SNS |
All years |
Kg N/ha |
78 |
72 |
6 |
30 |
0.23 |
|
Spring SNS |
2015 |
Kg N/ha |
100 |
72 |
28 |
32 |
0.04 |
|
Spring SNS |
2014 |
Kg N/ha |
78 |
65 |
13 |
22 |
0.10 |
|
Spring SNS |
2013 |
Kg N/ha |
78 |
68 |
10 |
35 |
0.46 |
|
Spring SNS |
2012 |
Kg N/ha |
82 |
86 |
-4 |
25 |
0.58 |
|
Spring SNS |
2011 |
Kg N/ha |
55 |
70 |
-15 |
17 |
0.03 |
|
Harvested SNS |
All years |
Kg N/ha |
100 |
97 |
3 |
43 |
0.63 |
|
Harvested SNS |
2015 |
Kg N/ha |
142 |
113 |
29 |
62 |
0.24 |
|
Harvested SNS |
2014 |
Kg N/ha |
92 |
81 |
11 |
37 |
0.40 |
|
Harvested SNS |
2013 |
Kg N/ha |
85 |
71 |
14 |
25 |
0.14 |
|
Harvested SNS |
2012 |
Kg N/ha |
96 |
108 |
-12 |
28 |
0.22 |
|
Harvested SNS |
2011 |
Kg N/ha |
88 |
112 |
-24 |
47 |
0.19 |
|
Winter wheat yield |
All years |
t/ha |
10.6 |
10.2 |
0.4 |
1.7 |
0.14 |
|
Winter wheat yield |
2015 |
t/ha |
13.1 |
12.3 |
0.8 |
1.9 |
0.30 |
|
Winter wheat yield |
2014 |
t/ha |
11.0 |
10.4 |
0.6 |
1.8 |
0.36 |
|
Winter wheat yield |
2013 |
t/ha |
8.8 |
8.5 |
0.3 |
1.7 |
0.72 |
|
Winter wheat yield |
2012 |
t/ha |
9.9 |
9.2 |
0.7 |
1.5 |
0.18 |
|
Winter wheat yield |
2011 |
t/ha |
10.6 |
10.9 |
-0.3 |
1.9 |
0.66 |
|
Significant (P <0.05) differences highlighted in bold and underlined. |
Discussion
Overall, both measures of soil mineral N in spring and of harvested SNS show that pulses provide equivalent N to the succeeding crop as OSR (72 vs 78 kg/ha and 97 vs 100 kg N/ha, respectively). Furthermore, there was no difference (P = 0.14) in average yield of fertilised crops following beans or OSR at 10.6 and 10.2 t/ha, respectively. We assume fertiliser N rates in these paired crops were equivalent, but it is possible that the N rates applied by farmers varied between crops following beans and OSR, conceivably confounding this comparison. The results demonstrated that spring SNS measurements (from both pulses and OSR) underestimated the amount of N supplied to winter wheat by c.25 kg N/ha on average, however, there is large inter-year variability, most likely reflecting differences in season and site conditions.
The results from 2011 to 2015 demonstrated that there were no differences in SNS, apparent mineralisation or winter wheat yield following pulse crops compared to OSR. The equivalence of N residues between oilseed rape and pulses showed the value of the ‘free’ nitrogen from peas and beans relative to the ‘paid for’ N residues from the inefficient use of fertiliser by the OSR crop.
Previous work conducted between 2008 and 2010 showed that although there was no significant difference in the estimate of harvested SNS between cereals and oilseed rape as previous crops, SMN measures under-estimated harvested SNS after pulses and field vegetables by around 25 and 35 kg/ha respectively. If the field had a known history of manure, then harvested SNS tended to be around 17 kg/ha greater than predicted just by measured SMN. The soil C:N ratio explained more of the variation in harvested SNS than either SOM% or soil total N% alone, and harvested SNS was around 1.4 kg/ha greater for each unit increase in C:N ratio. This was the opposite of what might be expected due to mineralisation. Spring sampling often substantially underpredicted harvested SNS following beans, and to a lesser extent peas.
Based on a limited number of sites, N residues were greater following beans than would be suggested by spring SMN measures, and perhaps from RB209 or SAC-TN625. It has been reported previously (Sylvester-Bradley & Cross, 1991) that N residues from beans appear to be mineralised more slowly than those from peas.
References:
ANGUS, J.F., KIRKEGAARD, J.A., HUNT, J.R., RYAN, M.H., OHLANDER, L. & PEOPLES, M.B. (2015). Break crops and rotations for wheat. Crop and Pasture Science 66, 523-552.
KINDRED, D. KNIGHT, S. BERRY, P. SYLVESTER-BRADLEY, R. HATLEY, D. MORRIS, N. HOAD, S. & WHITE, C. (2012). Establishing Best Practice for Estimation of Soil N Supply. In HGCA Project Report 490: HGCA.
LUCE, M.S., GRANT, C.A., ZEBARTH, B.J., ZIADI, N., O’DONOVAN, J.T., BLACKSHAW, R.E., HARKER, K.N., JOHNSON, E.N., GAN, Y., LAFOND, G.P., MAY, W.E., KHAKBAZAN, M. & SMITH, E.G. (2015). Legumes can reduce economic optimum nitrogen rates and increase yields in a wheat-canola cropping sequence in western Canada. Field crops Research 179, 12-25.
PREISSEL, S., RECKLING, M., SCHLÄFKE, N. & ZANDER, P. (2015). Magnitude and farm-economic value of grain legume pre-crop benefits in Europe: A review. Field Crops Research 175, 64-79.